Overview
‘MaxDiff’ (which stands for ‘Maximum Difference’) is an established process, used to generate a hierarchy of importance or appeal, from a list of attributes (for example, purchase decision drivers), which may be too numerous or too detailed to ask as a straight rating scale question, or as single paired trade-off questions. The advantage this method has over other ways of gauging relative importance, is that it allows all attributes to be compared to each other, using a relatively low number of questions, and quicker response times. However, this does require non-standard survey scripting (repeated and randomised loops) and results need to be generated via specialised software.
Ultimately, if utilised correctly, we will obtain greater discrimination in results between all of the attributes being tested compared to a straight appealing rating, whilst also generating the relative levels of preference / importance, between all the attributes.
Methodology
All possible pairs of attributes are evaluated, by showing respondents a set of only four (or sometimes five) of the attributes at one time, and asking them to pick which one they most prefer and which one they least prefer, out of the four (or five) shown.
For example, a respondent sees and evaluates four of twenty attributes being tested : A, B, C and D, and they indicate that A is their most preferred attribute of the four, and D is their least preferred attribute. From just these two answers we can make inferences on five out of six possible implied paired comparisons i.e. A > B, A > C, A > D, B > D, C > D.
The only paired comparison that cannot be inferred relate to the two attributes that were not chosen by the respondent i.e. B vs. C
Choosing out of four attributes, informs on five of six paired comparisons and a choice out of five attributes, informs on seven of ten paired comparisons.
The respondent then sees an alternate set of four (or five) attributes, and asked again to indicate their most preferred and least preferred out of that particular set. This continues until all attributes have been shown against each other; care should be taken in designing a set-up that ensures each attribute appears opposite all other attributes and that attributes appear in the most random order, as possible.
Results
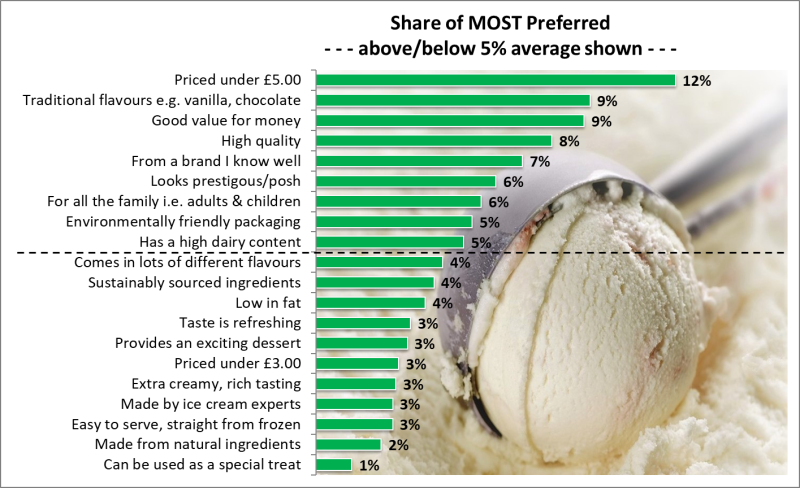
After fieldwork completion, results are generated via specialised software and comparative ratings between attributes are shown as a percentage share of preference, for ‘most preferred’ and for ‘least preferred’ ratings. These ratings can be expressed in terms of how much higher (i.e. more important attributes) or lower (i.e. less important attributes) they are than the expected mean rating, making it easy to see where marketing efforts should be concentrated, in order to generate the most effective gains in positive consumer perceptions.
Example
We asked regular ice cream buyers, to rate the appeal of 20 attributes using the standard MaxDiff set up, to measure and rank their relative importance. ‘Priced under £5.00’ is most motivating to these consumers, with ‘Traditional flavours’, ‘Good value for money’ and ‘High quality’ also important to them.